Infographics are eye-catching documents containing concise but useful information. They draw people in with their bold colours and imagery. But while they have you captured, they also provide facts, statistics and figures.
What is an infographic?
An infographic is a concise but informative piece of information that’s designed in a pleasing way. There are often images, bright colours and bold text. This is so the information is obvious while also being interesting to look at.
You want your infographics to be eye-catching. Otherwise, you’re not going to draw people in. They’re often used to provide statistics, data or facts. You might use one to explain a process – show your audience a step-by-step guide.
Or, perhaps you want to show your consumers your growth and profit margins. You might choose to display graphs alongside your data. Infographics are often displayed across various social platforms, but are also largely placed into PDFs and printed out to display physically.
What can you use an infographic for?
Since an infographic is an engaging way to share information, you can essentially create one for any topic. They’re a visual aid, acting as a resource for those who come across them. Whether you’re wanting to provide information, create a guide, or show a process – you can by creating an infographic.
 Here are some ways you can use them.
Provide snippets of information
Give your audience, or potential audience information about your product, brand or business. Rather than giving them huge paragraphs of information which they likely won’t read. Instead, give them a short but sweet summary. Ensure your infographic provides all key points that you want people to know. The rest? They can learn more through your website, or blog.
Break down a process
This could be used for a variety of reasons. Perhaps you’re a business, and you want to create infographics of various day-to-day processes your employees will need to do. Rather than constantly reminding them, you can prompt them through infographics. They’ll likely be pleased they can refer back to a cheat sheet as a reminder.
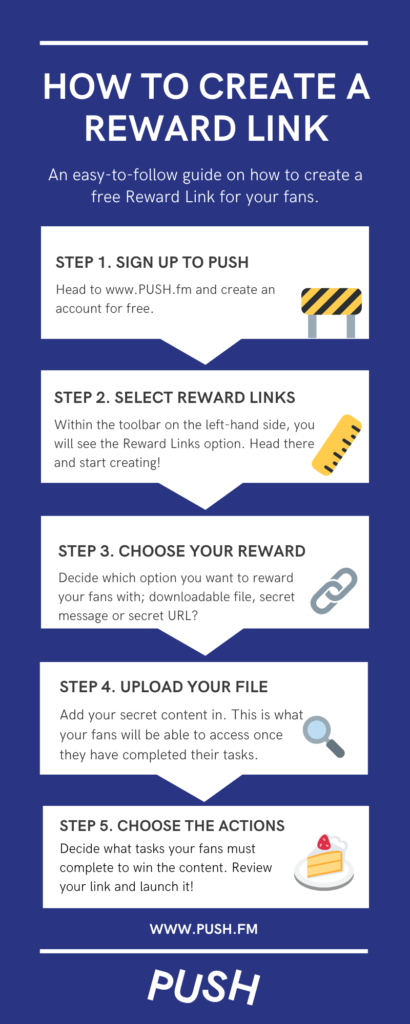
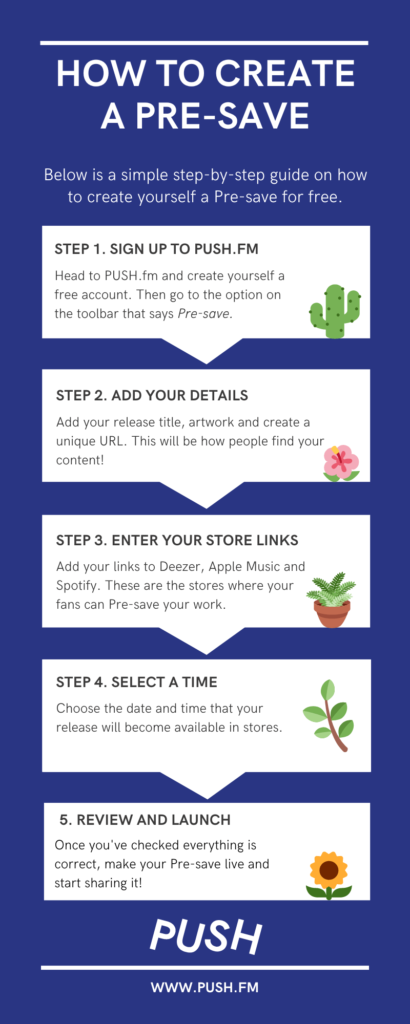
You might also want to break down a process to your audience, or consumers. For example, we have broken down how to create a Pre-save into simple steps. This then doesn’t overwhelm anyone reading it because it isn’t packed with information. Instead, it has the relevant and necessary steps.
Share data or statistics
Add your statistics to an infographic, and clearly show your development. They act as an easy way to share your results with an audience. Whether it be employees, or your consumers. If you need to share data, an infographic is a great way to do it. You can share them across social platforms too, meaning everyone can view your progress.
Take key points from an article
Not everyone has the time, nor wants to read an entire article. If you’ve got this far in this one, a big thanks to you! But some people want the information but without having to read it. This is where infographics are great because they only have to read a small amount of text but get an overall summary of what’s going on.
How do you create an infographic?
Creating an infographic is easy, if you’ve prepared your content. You need to know what aim your infographic has. Otherwise, you’ll confuse your audience because your content won’t make sense. Consider what information you want to present to them, and how you can do that efficiently.
Once you have your information laid out in front of you, that’s when you can start cutting bits out to create something clear and not text heavy. There are multiple platforms you can create an infographic on, it’s about finding the right one for you. Many of these are free too, so you don’t have to worry about the company cost.
A personal favourite of ours is Canva. This is because they have a section dedicated to infographics. There are multiple template choices. Or, you can start from scratch, but with the correct formatting and image size. It makes life much easier because you don’t have to resize any of your work. It’s the correct requirements before you start.
However, with this being said, there are so many platforms you could choose. Designing it through a site that offers templates is beneficial if you’re starting out with infographics. This allows you to see examples and gain inspiration of what designs might work for your company.
Below are a few things to consider before getting started.
Consider your desired outcome
A huge thing to consider before you get started is what you want to achieve. Otherwise, you’re going to start creating with no clear goal. If you have clear expectations, e.g. you want more people to start using your products, then consider this. Perhaps make an infographic containing statistics of how many people have used your product and would recommend it.
When you have an end goal in mind, it makes it easier to get creating. This is because you know what you want people to think or feel when they view your infographic. If you know this, you’ll know which method to take when creating one. Each infographic needs to have a clear theme or objective.
If you have multiple products, or you’re talking about various areas of your business, create multiple infographics. Don’t combine them into one. It will become information heavy, and just confusing overall. You need each infographic to be clear about its topic. So by outlining what the topic is before you start, there will be no room for confusion.
Decide your image content
Before you just go for it, consider what images (if any) you want to include. The reason for this is, it’s hard to add images in at the end. If you’ve added your text, there often won’t be room for images. This is because we all have a tendency to fill in blank spaces. We don’t like visual aids looking blank, so we fill them.
Therefore, if we haven’t already decided where our images are going, or if we’re including any, typically the space gets filled with excess text. Too much text will put many off reading your infographic, so it’s important you find the sweet spot. Likewise, you’ll end up having to delete text or shift things around if you later want to add images.
Consider your image choices first. They act as a visual guide for an individual. Or, they’re just simply an eye-catching tool that could draw people in. Once you have their attention, they might read your infographic. Try placing your images first, and add the text from there. You’ll find it’s much easier this way.
Refine your key points
As mentioned previously, infographics are an information source. However, they’re also a visual aid. Therefore, you don’t want to overwhelm anyone with too much text. It will likely be hard to read, because the more you try to fit on, the smaller your text will become. There’s only so much room.
Figure out what you want to say, and then refine your points for each area within your topic. The more concise you make your points, the more likely people are to read them. You’d think people want more information about the topic, but this isn’t the case.
You need to try and sell your point to them in as few words as possible. If they take an interest, they’ll head to your company, or brand to find out more. Giving them too much too soon doesn’t give them a reason to take a look at your work. It probably puts them off before they’ve even considered you.

The creation process
Once you have everything above decided, you can get started creating your infographics. Depending on your chosen platform will depend on what the process looks like for you. However, we’d recommend finding a template that suits your brand, and working with it.
If you can’t find one, or want to make your own – go for it! But, perhaps look at some examples first for inspiration. Just so you can see how different mock ups create different results. Consider the image requirements and ensure your document is set to the correct format before getting started.
Please note: This is an example of creating an infographic in Canva. If you choose another platform, your view will appear different.
Once you have your template in front of you, you can start adding your information. If you’re wanting to copy the template as it is, you’ll need to remove the example information and input yours in its place. However, if you’re wanting to edit things like the font, or font colour you’ll need to remove the example text and play around with your own to find what works.
Ensure you add your images before you’ve added too much text to your page. As mentioned previously, if you go text heavy, you’ll have no room for images. If you’re using a template it’s likely it will have places set out for images. However, if not, you’ll have to consider where you want to place them.
Add in your information and ensure everything has been spell checked. Otherwise, you run the risk of printing or sharing incorrect content. Try different colour schemes out, and keep your branding in mind when you do. From here, it’s all about your own creative side. Find what looks best for your brand.