By learning what your Facebook page’s analytics and insights mean, you can really make the most of the goldmine of statistics you’ve got access to.
 How to access your page insights
It sounds obvious, but in order to access your Facebook page insights, you’ll need a Facebook Business page. Once set up, you can start exploring this wealth of data and information.
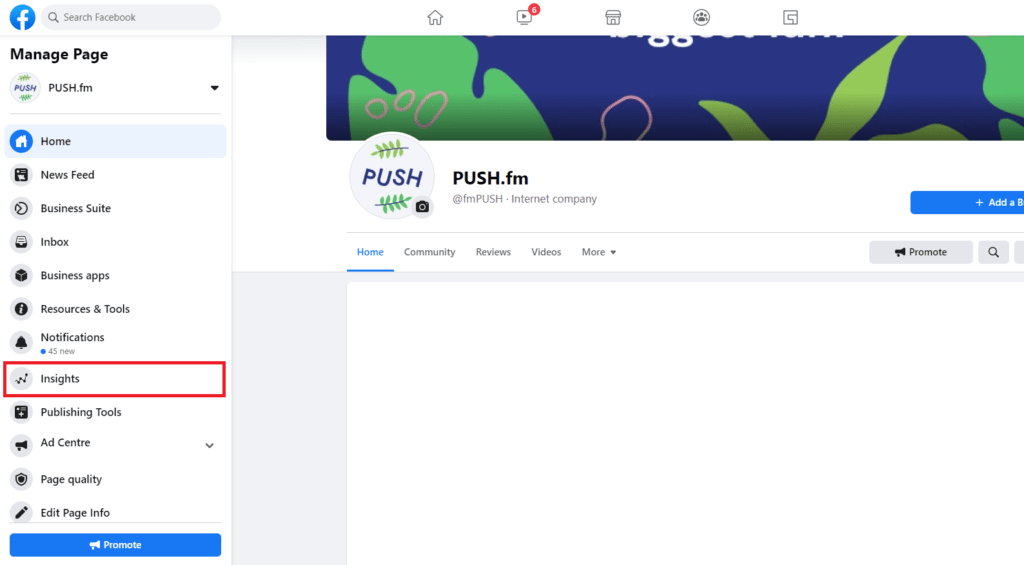
Head over to your Facebook business page and click on ‘insights‘ in the side bar.
If you can’t find the ‘insights‘ button, it may be hidden under the ‘more‘ tab.

Once you’ve navigated to the insights page, you’ll be presented with your insights overview.
Here you can see a birds-eye view of different statistics into how people have seen, interacted and engaged with your page and posts.
This data can be toggled by different time frames; view data from today, yesterday, the last 7 days or the last 28 days.
If you want a more detailed look into a certain data set, simply click on the chart you want to find out more about.
 What does each insight mean?
Each insight will be displayed via a nifty graph and will include a comparison to the previous time period so you can see if your page has performed better, or worse, then before.
If there is not enough data for a certain statistic, no chart will appear and an insufficient data message will appear. If this happens, try toggling a longer time period or if still lacking data, look into how to increase this type of statistic.
 Actions on page
This shows you the number of times people have clicked on your page’s contact info or your primary action button. This statistic shows you if people are actively trying explore more of your content, contact you and/or seek out your other pages or products.
👀 Page views
A self-explanatory statistic, telling you how many people have viewed your Facebook page. Both people who are logged in and logged out count towards this statistic. This means any traffic from non-internal sources such as Google searches are included.
 Page likes
Again another self-explanatory insight. This shows you how many people have liked your page, along with the change (if any) from the different time period.
If you’re running paid promotions, it’ll also show you how many likes have come from your paid promotion, or from organic reach.
Post reach
Post reach tells you how many people have seen your page or posts in their timeline. When people interact with your posts, your page reach is likely to increase as it reaches new audiences.
In the same way as likes, this is broken down into paid promotion and organic reach. If you’re running a paid promotion you should expect this statistic to be higher than if you weren’t.
 Story reach
This statistic operates in the same way as post reach but instead involves your Facebook stories. People sharing your stories will help contribute to your overall story reach.
 Recommendations
Whenever someone recommends your page, it will show up here. Recommendations have to be set up by you before people can recommend your page, which you can find out how to do here.
 Post engagement
Every reaction, like, comment, click and share counts towards your post engagements. Having a good and consistent post engagement is every brand or artist’s dream as it shows that your fans are wanting to interact with the content you post.
 Video
Video
If you have uploaded any videos to your business page, any views longer than 3 seconds will show up here. The more engaging a video is, the more it’ll hold people’s attention and increase this statistic.
If your video is shorter than 3 seconds, any people who have viewed the majority of the video will also count.
Like page and post reach, this statistic can also be broken down by paid promotion and organic views.
 Page followers
The final graph is that of how many people are following your page and are wanting to keep up to date with the content you post. “But what’s the difference between likes and follows” we hear you say?
People who follow your page will sign up to receive updates and posts from your page in their news feeds (subject to the Facebook algorithm).
People who like your page will automatically follow your page, and their name will also appear as being a fan of your page. The difference here is that people who like your page can choose to ‘unfollow‘ your page so they won’t receive updates but their name will still appear as a fan of the page.
If you want to find out more, Digida has a great write up about the differences between likes and follows.
 Your 5 most recent posts
As you scroll down your overview, you’ll also notice a new section titled ‘Your 5 Most Recent Posts‘. This does exactly what it says on the tin and shows you various statistics about your 5 most recent posts and their respective insights.
Here you’ll see your most recent posts:
- Post type – whether your post is a text, image or video post.
- Post targeting – who your post is shared with.
- Reach – how many people saw your post.
- Engagement – how many people either clicked on, or engaged with your post (reactions, comments or shares)
- Options to promote – from here you can choose to boost a post using Facebook’s advertising platform.
 Pages to watch
The final segment of your overview gives you a chance to see how your pages compare with other similar pages on Facebook. Simply click ‘Add Pages‘ to get started comparing total page likes, growth, number of posts and overall engagement.
If you want to explore more about Facebook’s extensive insights and really get a handle on how it can be a handy marketing resource, check out their collection of Facebook for Business lessons and walkthroughs.