The Spotify for artists dashboard is both a blessing and a curse. It provides a mountain of data, but if you spend your morning staring at the “People listening now” counter, you are likely wasting your time.
In an era where “fake streams” and “passive listening” are rampant, knowing how to separate vanity metrics from genuine career growth is essential.
To master your dashboard, you need to look past the big numbers and find the story the data is trying to tell.
1. The “Big Three” vs. the “Growth Three”
Most artists obsess over their monthly listeners. While this looks great on a press kit, it is a volatile number that fluctuates based on playlist placement. To understand your true momentum, you must look at your engagement metrics:
- The conversion rate (Follower-to-listener ratio): If you have 100,000 monthly listeners but only 500 followers, your music is likely sitting in “passive” background playlists (like Chill Lofi Beats). You want to see your follower count growing steadily, as these are the people who will actually be notified when you release your next track.
- The save rate: Found in the “Music” tab, this is the percentage of listeners who added your song to their library. A save rate of 10% or higher is a massive signal to the Spotify algorithm that your song has “staying power.”
- The listener-to-stream ratio: If your average listener streams your track 3.5 times, you’ve found a fan. If they stream it 1.1 times, you’ve found a casual passerby.
2. Identifying your traffic sources
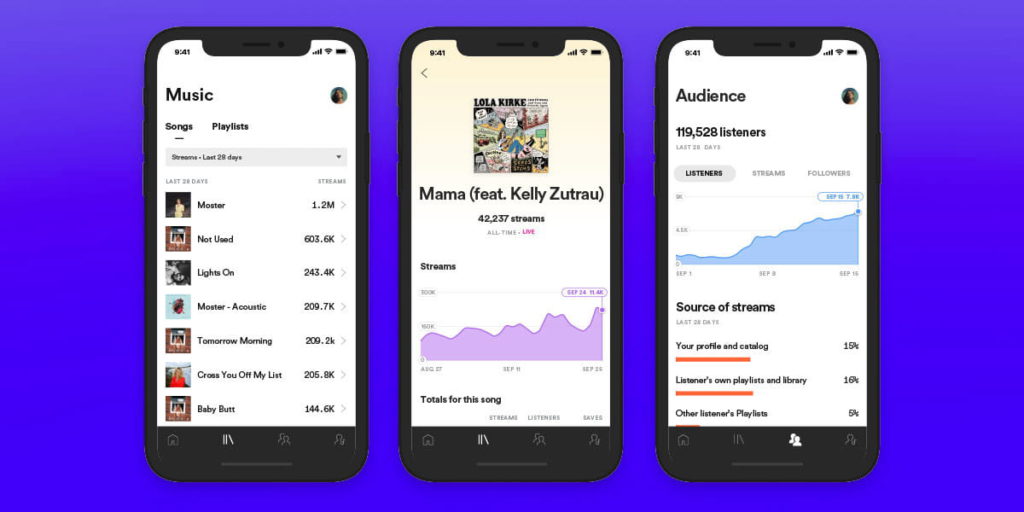
The “Source of streams” section is the most honest part of your dashboard. It breaks down exactly where your plays are coming from:
- Your profile and catalogue: This is the “gold standard.” It represents fans explicitly searching for your name or playing from their own libraries.
- Algorithmic playlists: This includes Discover Weekly, Release Radar, and Radio. If this number is high, the Spotify AI likes you. This is “free” marketing that you earn by having high save and skip-rate scores.
- Editorial playlists: These are the “hand-picked” slots like New Music Friday. They are great for a temporary spike, but they are often low-engagement. Don’t be discouraged if your “monthly listeners” drop significantly once you fall off a major editorial list.
3. The “Discovery” tab: where are they finding you?
In 2026, the “Listeners also like” section is your best tool for collaboration and targeting. This shows you which other artists’ fans are being fed your music.
If you see artists listed there who sound nothing like you, your metadata might be confusing the algorithm. If you see artists you admire, you’ve found your perfect audience for Meta Ads or tour support slots.
4. Real-time data and the “first 24 hours”
When you drop a new single, the “Real-time” stats are vital for the first 24 hours. This is the only time vanity metrics matter, as a massive initial spike can trigger the Release Radar algorithm for the following Friday.
Top Tip: Check your “Top Cities” frequently. If you see a sudden surge in a random city like Jakarta or Helsinki, it’s time to investigate if a local influencer has used your sound or if you’ve been added to a significant regional playlist.
Summary: Your 2026 dashboard checklist
| Metric | Why it matters |
|---|---|
| Follower Growth | Indicates long-term fan loyalty. |
| Saves & Playlist Adds | Tells the algorithm your song is worth “keeping.” |
| Listener-to-Stream Ratio | Measures the “addictiveness” of your music. |
| Top Cities | Helps you plan tours and targeted ad spend. |
The dashboard isn’t just a scoreboard; it’s a map. Use it to stop guessing where your fans are and start meeting them exactly where they live.