Google Analytics offers valuable insights into conversion rates, sourcing traffic and engagement rates. You will be able to see what areas of your website are performing well and more importantly, which areas aren’t.

If you aren’t making the most out of Google Analytics, keep reading. It allows you to see in-depth statistics and data from your website. This lets you see what is working, and what isn’t working so well. It’s important to continue to check your metrics, otherwise your website could see a huge drop in traffic which could be hard to come back from.
Google Analytics – what are they?
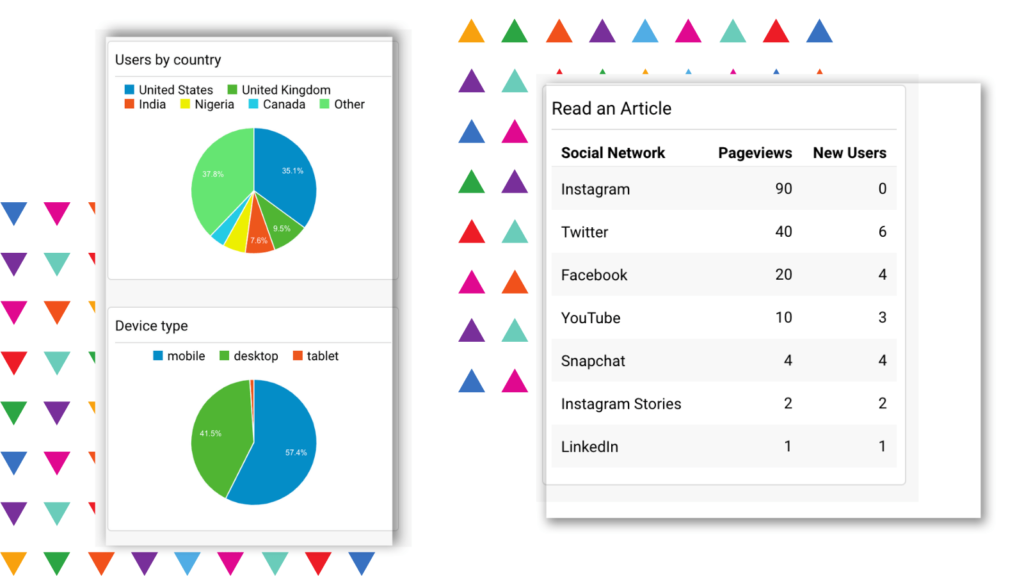
Google Analytics allow you to track your website. You can see how your audience engage with you best. You’re able to sync up your social media platforms too, which will allow you to see exactly where your traffic is coming from. See which social media site is worth focusing on by viewing the traffic they bring in.
Track the amount of views your website is getting, where they came from and how many times they’re visiting your site. It gives you real-time insights into how powerful your marketing is and whether you’re successful. It’s completely free to use. Your business doesn’t have to pay out to access the same high level tools as other brands.
It can be tricky to set up. Google Analytics are complex to understand for complete beginners, however, there are many tutorials online which you can access. These will walk you through setting up your own metrics tracker. You are then able to section off different areas of your website, to track separately. For example, you could split your blog and website traffic.
You will need to wait for data to be collected. Google Analytics are not able to search back through your website for data. Instead, once you have set it up, it will immediately start to collect information. Social media platforms have insights and statistics, but it isn’t as thorough as Google Analytics. Also, they don’t track your website.
The basics of Google Analytics
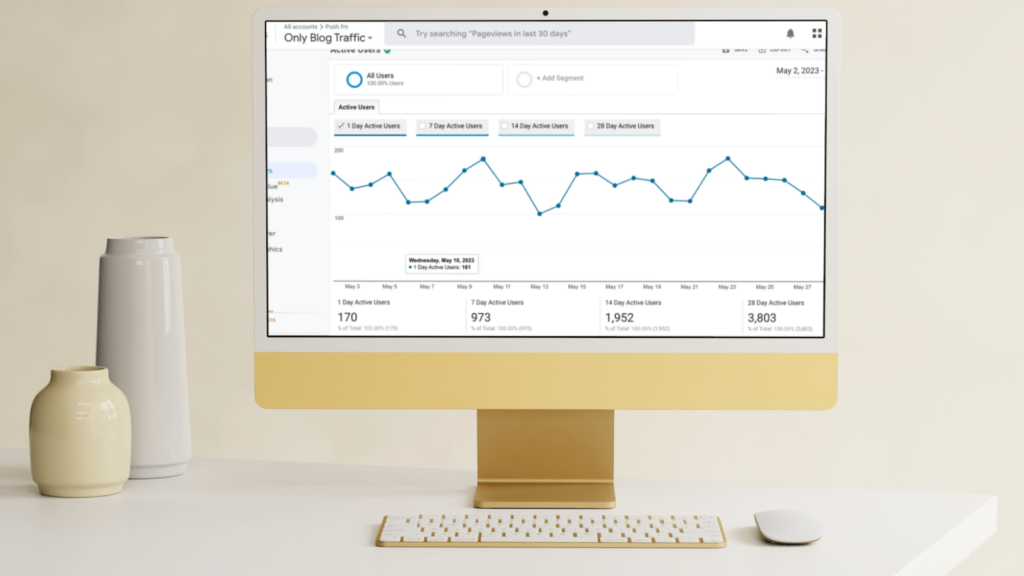
You’ll need to first create an account. Once you have set this up, you can start adding URLs which you want to track. These can then be accessible via your dashboard. You can switch between your various URLs by exploring your drop-down menu. The main view you will see is your traffic over time. You can adjust the timeframe, seeing short lengths of time compared to longer ones.
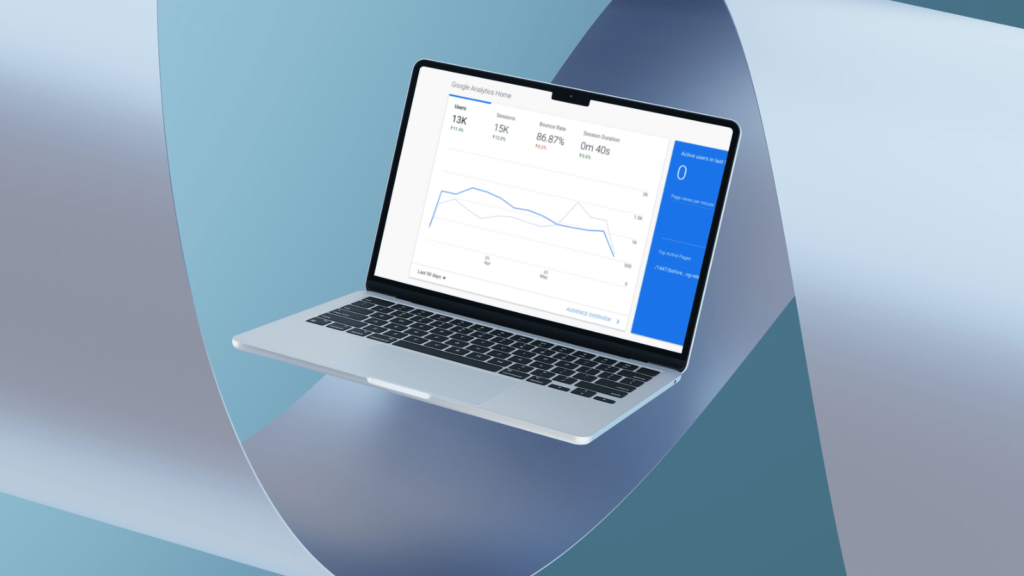
You can see the number of active users on the right-hand side. This will show you how many are using your website at that time, so you can gauge what times your site is at its busiest. You’re also able to see details such as where the majority of your users are based, which might help you figure out the times your website is most popular.
There is a search bar which will allow you to look into specific areas of your website. The more you get used to using Google Analytics, the more you will understand how to find the data you are looking for. It will help you understand what your audience most want to see. Alter your timeframe to see how your website is growing.
If you start to see dips, you can potentially review any changes you made to the site that could be causing this. It’s advisable to create a document that you can add your weekly or monthly statistics too. There, you can keep a full track of everything going on with your website. The good and the bad.
Tracking traffic sources using Google Analytics
Finding out how people are discovering your website is an advantage every business wants. It allows you to focus your efforts there instead of trying to boost platforms that aren’t working for you. You need to target the areas your audience are interested in and not those where they aren’t active.
While you cannot source private user data, such as their exact location, who they are and their contact information, you can source other details. You can find out which pages people are visiting more often which will help you decide what works and what doesn’t ahead of future content creation.
There are very useful insights such as what devices your audience are using. Again this won’t tell you personal information such as the make and model, but you don’t need to know this. Instead, you can discover if they’re accessing your site via desktop or mobile. This will allow you to format your pages for various devices.
Track the not so good in Google Analytics
When it comes to a blog, there are certain articles that will outshine others. This is due to a variety of things such as; your SEO scores, the information within them, whether you answer their questions quickly or keep them waiting and just the general format of your article. All of these elements will determine how well your article will perform.
Those who aren’t performing well will appear within Google Analytics under the not so good section. These show you articles that could be improved. However, it’s important to note, articles that have been on your website for a long time will decrease in popularity. Those who want to read that topic likely already have.
So, naturally over time your articles will start to appear there. If your articles are appearing under that section from the start, you’ll need to look into why this could be. What is different about that one? To get to the not so good, you need to go to Behaviour and then Site Content. This isn’t just for blogs either, it could be any element of your website.
Find where people are leaving your site
With any business, it’s a good idea to know why people are leaving your website and where they’re leaving from. This might show you what you need to change to keep people browsing for longer. Especially if you’re an e-commerce website. You rely on sales and therefore don’t want people clicking off your site before purchasing anything.
Monitor your check-out pages. Understand what users might see and where you’re going wrong. If you continue to get people backing out before check-out consider how you can encourage them to come back. Could you send a discount code to their email if you have it? Perhaps you could introduce a pop-up discount code if they’ve spent a long time on the payment page.
How to create a custom report on Google Analytics
Once you start to understand your metrics, you might want to start separating them from each other. You can do this by creating custom reports. These will be more specific and allow you to make comparisons between various links and campaigns. You can design your own layout, so you’re in charge of how your report appears.
Here’s how to create your custom report:
- Click Customization.
- Choose Custom Reports.
- Click + New Custom Report.
- Name your report.
- Choose what areas you want to include within the report. (The question marks to the side will explain what each option refers to).
- Decide whether you want to see all or a limited amount of views.
- Click Save.
Now you can access your report from the sidebar. Select the custom report option. Then from there you can choose the report you want to look at. You’re able to make multiple reports for each area you want to focus on. Within each report you can choose different statistics to monitor. What do you want to gain from that part of your website?
No matter how you use them, Google Analytics are beneficial to any brand, business or website. They allow you to track where you’re going wrong and what you’re doing right. This helps you decide where to make changes. You can tailor your content to your audience depending on their location and therefore the times they’re online. Start using them, and you’ll soon understand how it best works for you.